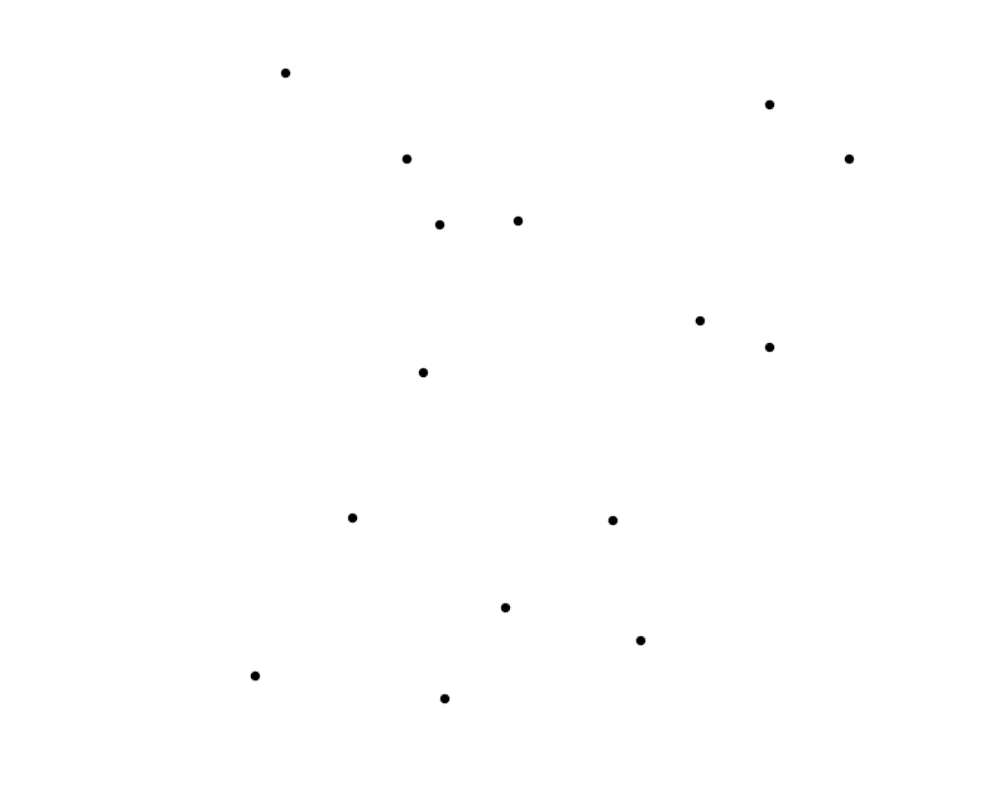
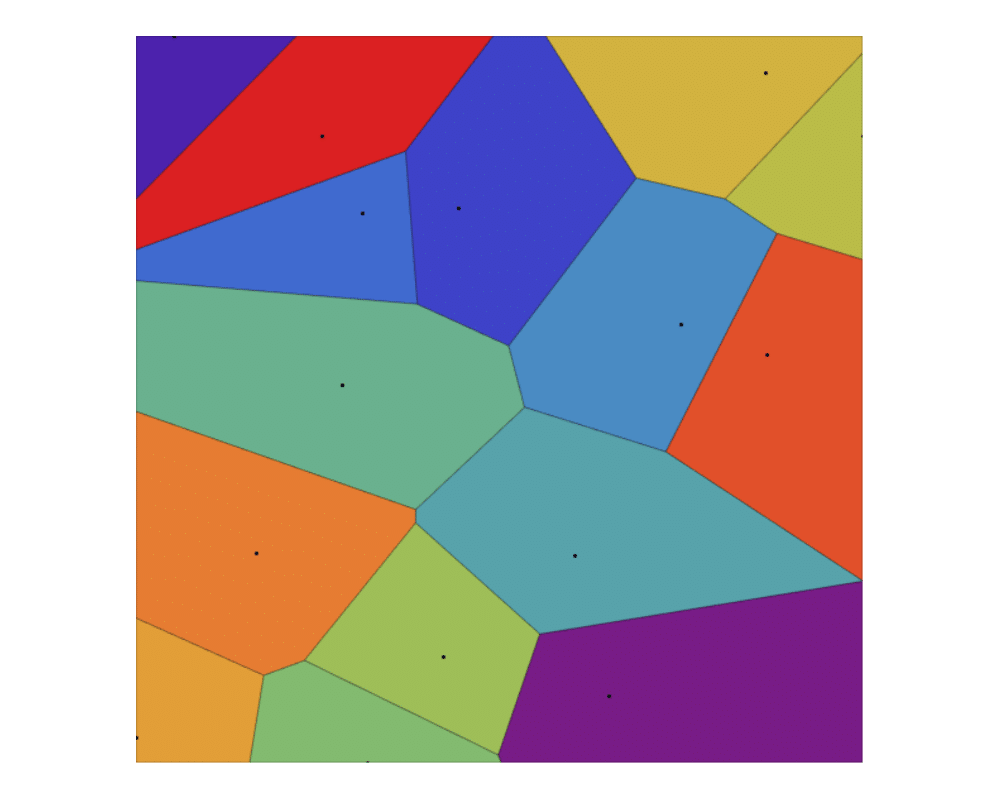
Input Description: A set \(S\) of points \(p_1,...,p_n\).
Problem: Decompose the space into regions around each point, such that all the points in the region around \(p_i\) are closer to \(p_i\) than any other point in \(S\).
Excerpt from The Algorithm Design Manual: Voronoi diagrams represent the region of influence around each of a given set of sites. If these sites represent the locations of McDonald's restaurants, the Voronoi diagram partitions space into cells around each restaurant. For each person living in a particular cell, the defining McDonald's represents the closest place to get a Big Mac.
Voronoi diagrams have a surprising variety of uses:
- Nearest neighbor search -- For a query point \(q\), finding its nearest neighbor from a fixed set of points \(S\) is simply a matter of determining which cell in the Voronoi diagram of \(S\) contains \(q\).
- Facility location -- Suppose McDonald's wanted to open another restaurant. To minimize interference with existing McDonald's, it should be located as far away from the closest restaurant as possible. This location is always at a vertex of the Voronoi diagram, and it can be found in a linear-time search through all the Voronoi vertices.
- Largest empty circle -- Suppose you needed to obtain a large, contiguous, undeveloped piece of land on which to build a factory. The same condition used for picking McDonald's locations is appropriate for other undesirable facilities, namely that it be as far as possible from any relevant sites of interest. A Voronoi vertex defines the center of the largest empty circle among the points.
- Path planning -- If the sites of \(S\) are the centers of obstacles we seek to avoid, the edges of the Voronoi diagram define the possible channels that maximize the distance to the obstacles. Thus in planning paths among the sites, it will be ``safest'' to stick to the edges of the Voronoi diagram.
Implementations
Recommended Books
Related Problems
Go To Main Page


